قالب الخط الزمني
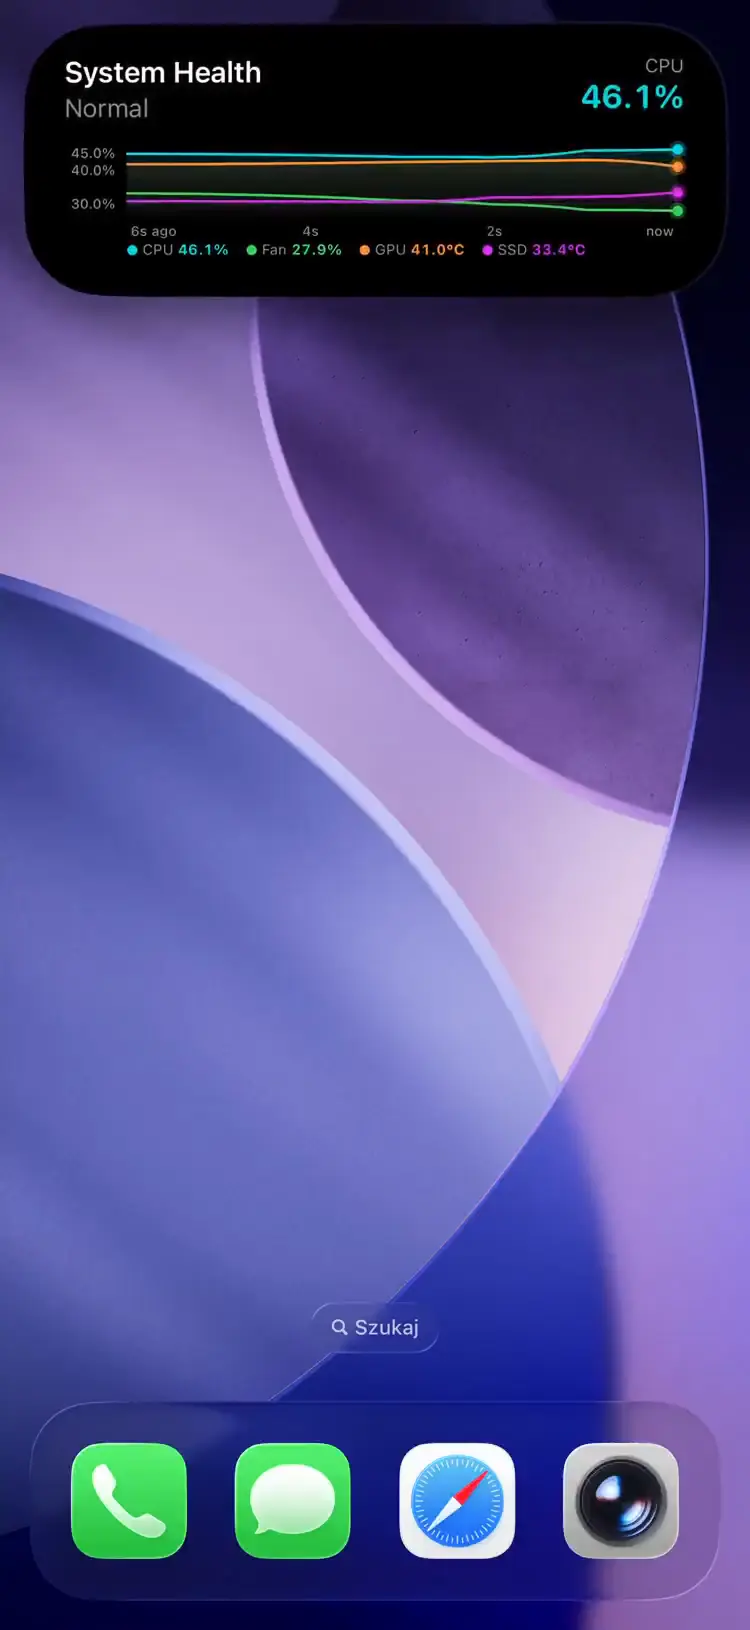
مخطّط sparkline فوري لتتبّع القيم عبر الزمن. يرسل كل إشعار نقطة بيانات؛ يجمع الخادم السجلّ ويسلّم بيانات الـ sparkline إلى iOS عبر الإشعارات.
Fields
| Field | Type | Description | ||||||||||||||||||||||||||||||||||||||||||||||||||||||||||||||||||||||||||||||||||||||||||||||||
|---|---|---|---|---|---|---|---|---|---|---|---|---|---|---|---|---|---|---|---|---|---|---|---|---|---|---|---|---|---|---|---|---|---|---|---|---|---|---|---|---|---|---|---|---|---|---|---|---|---|---|---|---|---|---|---|---|---|---|---|---|---|---|---|---|---|---|---|---|---|---|---|---|---|---|---|---|---|---|---|---|---|---|---|---|---|---|---|---|---|---|---|---|---|---|---|---|---|---|
template | string | Required. Must be "timeline" | ||||||||||||||||||||||||||||||||||||||||||||||||||||||||||||||||||||||||||||||||||||||||||||||||
value | object | The data point(s) for this push. Required. A labeled map (e.g. {\"CPU\": 72.5} or {\"CPU\": 72.5, \"GPU\": 45.2}). Max 10 series, 32-char keys | ||||||||||||||||||||||||||||||||||||||||||||||||||||||||||||||||||||||||||||||||||||||||||||||||
unit | string | Unit suffix on value display (e.g. "°C", "%"). Max 32 characters. Used as fallback when units is set | ||||||||||||||||||||||||||||||||||||||||||||||||||||||||||||||||||||||||||||||||||||||||||||||||
units | object | Per-series unit overrides. Keys must match value keys; missing keys fall back to unit. Max 32-char values | ||||||||||||||||||||||||||||||||||||||||||||||||||||||||||||||||||||||||||||||||||||||||||||||||
scale | string | Y-axis scaling: "linear" (default) or "logarithmic" | ||||||||||||||||||||||||||||||||||||||||||||||||||||||||||||||||||||||||||||||||||||||||||||||||
decimals | integer | Decimal places for display. null = auto-detect. Range 0–10 | ||||||||||||||||||||||||||||||||||||||||||||||||||||||||||||||||||||||||||||||||||||||||||||||||
smoothing | boolean | Curve interpolation between points. Default: false (straight segments) | ||||||||||||||||||||||||||||||||||||||||||||||||||||||||||||||||||||||||||||||||||||||||||||||||
thresholds | array | Up to 5 horizontal reference lines. Each has value (required), color, and label (max 12 chars) | ||||||||||||||||||||||||||||||||||||||||||||||||||||||||||||||||||||||||||||||||||||||||||||||||
state | string | Status text (e.g. "Heating", "Monitoring") | ||||||||||||||||||||||||||||||||||||||||||||||||||||||||||||||||||||||||||||||||||||||||||||||||
icon | string | SF Symbol name (e.g. "chart.xyaxis.line") or MDI icon with mdi: prefix | ||||||||||||||||||||||||||||||||||||||||||||||||||||||||||||||||||||||||||||||||||||||||||||||||
accent_color | string | Named color or hex. Default: teal | ||||||||||||||||||||||||||||||||||||||||||||||||||||||||||||||||||||||||||||||||||||||||||||||||
| قادم في إصدار التطبيق 1.3.3 | ||||||||||||||||||||||||||||||||||||||||||||||||||||||||||||||||||||||||||||||||||||||||||||||||||
primary_series | string | Names which series drives the headline value and the compact high/low range on iOS. Max 32 chars, and must match one of the value keys to take effect. When omitted (or naming an unknown key), the alphabetically-first series is used. | ||||||||||||||||||||||||||||||||||||||||||||||||||||||||||||||||||||||||||||||||||||||||||||||||
| قادم في إصدار التطبيق 1.14.0 | ||||||||||||||||||||||||||||||||||||||||||||||||||||||||||||||||||||||||||||||||||||||||||||||||||
compact_label | string | Optional, max 4 characters. Replaces the high/low stack in the Dynamic Island compact leading ear. The minimal presentation ignores it. | ||||||||||||||||||||||||||||||||||||||||||||||||||||||||||||||||||||||||||||||||||||||||||||||||
Each push appends a timestamped data point to the server-managed history, which never needs to be sent: a seed on the first update is honored, but once any history exists a client-supplied history is ignored. Up to 300 points per series are stored; APNs payloads are dynamically downsampled via LTTB to fit 4KB while preserving peaks and visual shape.
Renders url_action and secondary_url_action as buttons below the sparkline; tap_action covers taps elsewhere on the card — see Tap actions.
Example: Single Value
{
  "state": "ongoing",
  "content": {
    "template": "timeline",
    "value": {"Temperature": 13.7},
    "unit": "°C",
    "state": "Heating",
    "icon": "thermometer.medium",
    "accent_color": "orange",
    "smoothing": true
  }
}
Example: Multi-Value with Thresholds
{
  "state": "ongoing",
  "content": {
    "template": "timeline",
    "value": {
      "CPU": 72.5,
      "GPU": 45.2,
      "Fan": 60.0,
      "SSD": 38.1
    },
    "unit": "%",
    "units": { "GPU": "°C", "SSD": "°C" },
    "state": "Monitoring",
    "primary_series": "CPU",
    "thresholds": [
      { "value": 80, "color": "red", "label": "Critical" },
      { "value": 60, "color": "orange" }
    ]
  }
}يصف هذا القسم ميزة في تحديث للتطبيق قيد مراجعة App Store. يُفتح هنا تلقائيًا بمجرد أن يصبح التحديث متاحًا.
With more than one series, set primary_series: the non-primary series still draw as lines behind the headline.
Value-only updates are delivered at low priority to conserve the iOS push budget. Changing scale, smoothing, decimals, unit, or units triggers high-priority delivery.
Use Cases
- Server monitoring — CPU temperature, memory usage, network throughput over time
- Smart home — room temperature trends, humidity tracking, energy consumption
- 3D printing — hotend/bed temperature curves during a print
- CI/CD — build time trends, test suite duration over consecutive runs