Plantilla de línea de tiempo
Un minigráfico en tiempo real para seguir valores a lo largo del tiempo. Cada envío añade un punto de datos; el servidor acumula el historial y entrega los datos del minigráfico a iOS mediante notificaciones push.
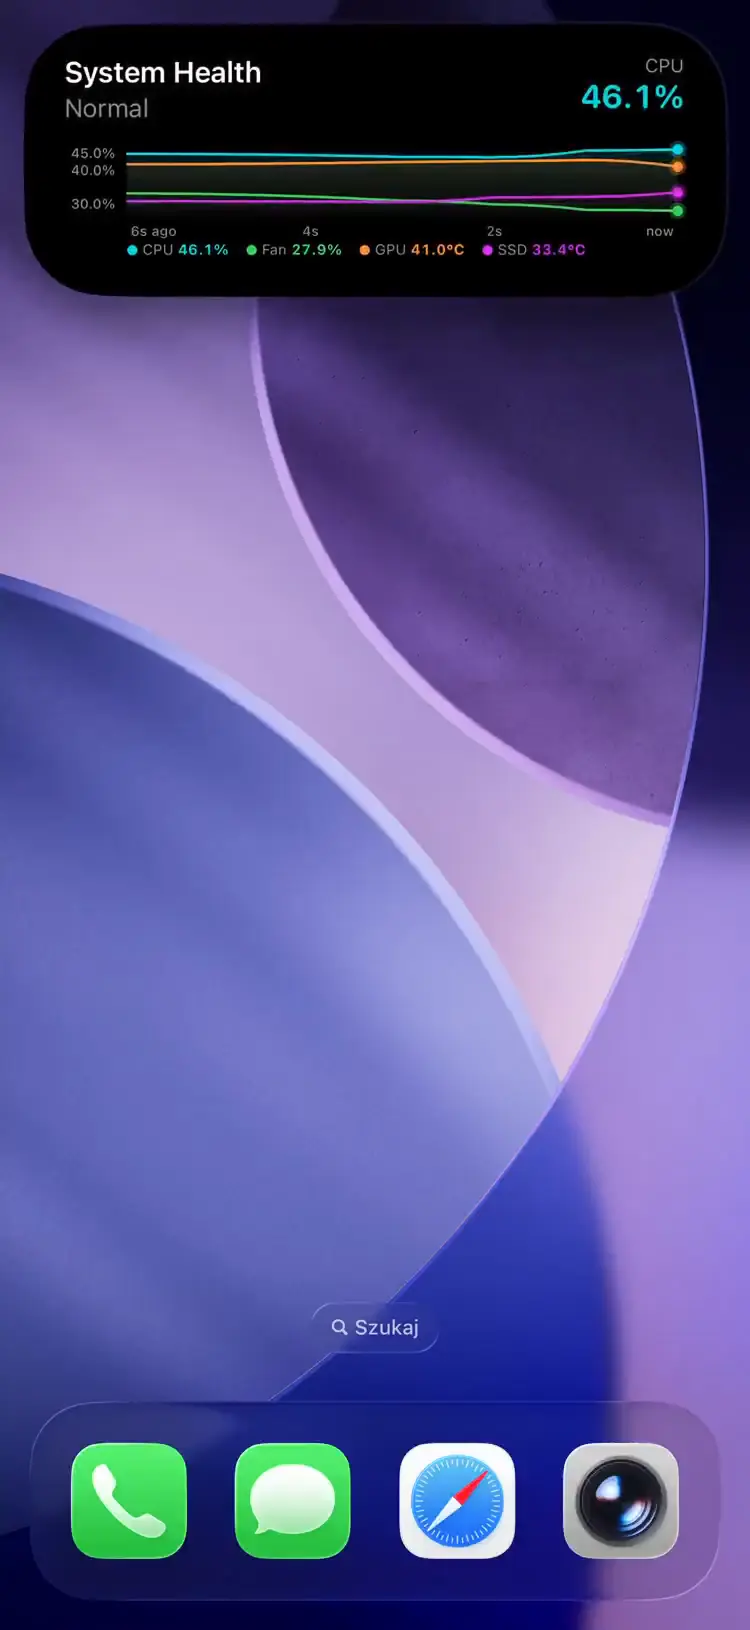
Fields
| Field | Type | Description | ||||||||||||||||||||||||||||||||||||||||||||||||||||||||||||||||||||||||||||||||||||||||||||||||
|---|---|---|---|---|---|---|---|---|---|---|---|---|---|---|---|---|---|---|---|---|---|---|---|---|---|---|---|---|---|---|---|---|---|---|---|---|---|---|---|---|---|---|---|---|---|---|---|---|---|---|---|---|---|---|---|---|---|---|---|---|---|---|---|---|---|---|---|---|---|---|---|---|---|---|---|---|---|---|---|---|---|---|---|---|---|---|---|---|---|---|---|---|---|---|---|---|---|---|
template | string | Required. Must be "timeline" | ||||||||||||||||||||||||||||||||||||||||||||||||||||||||||||||||||||||||||||||||||||||||||||||||
value | object | The data point(s) for this push. Required. A labeled map (e.g. {\"CPU\": 72.5} or {\"CPU\": 72.5, \"GPU\": 45.2}). Max 10 series, 32-char keys | ||||||||||||||||||||||||||||||||||||||||||||||||||||||||||||||||||||||||||||||||||||||||||||||||
unit | string | Unit suffix on value display (e.g. "°C", "%"). Max 32 characters. Used as fallback when units is set | ||||||||||||||||||||||||||||||||||||||||||||||||||||||||||||||||||||||||||||||||||||||||||||||||
units | object | Per-series unit overrides. Keys must match value keys; missing keys fall back to unit. Max 32-char values | ||||||||||||||||||||||||||||||||||||||||||||||||||||||||||||||||||||||||||||||||||||||||||||||||
scale | string | Y-axis scaling: "linear" (default) or "logarithmic" | ||||||||||||||||||||||||||||||||||||||||||||||||||||||||||||||||||||||||||||||||||||||||||||||||
decimals | integer | Decimal places for display. null = auto-detect. Range 0–10 | ||||||||||||||||||||||||||||||||||||||||||||||||||||||||||||||||||||||||||||||||||||||||||||||||
smoothing | boolean | Curve interpolation between points. Default: false (straight segments) | ||||||||||||||||||||||||||||||||||||||||||||||||||||||||||||||||||||||||||||||||||||||||||||||||
thresholds | array | Up to 5 horizontal reference lines. Each has value (required), color, and label (max 12 chars) | ||||||||||||||||||||||||||||||||||||||||||||||||||||||||||||||||||||||||||||||||||||||||||||||||
state | string | Status text (e.g. "Heating", "Monitoring") | ||||||||||||||||||||||||||||||||||||||||||||||||||||||||||||||||||||||||||||||||||||||||||||||||
icon | string | SF Symbol name (e.g. "chart.xyaxis.line") or MDI icon with mdi: prefix | ||||||||||||||||||||||||||||||||||||||||||||||||||||||||||||||||||||||||||||||||||||||||||||||||
accent_color | string | Named color or hex. Default: teal | ||||||||||||||||||||||||||||||||||||||||||||||||||||||||||||||||||||||||||||||||||||||||||||||||
| Llega en la versión 1.3.3 de la app | ||||||||||||||||||||||||||||||||||||||||||||||||||||||||||||||||||||||||||||||||||||||||||||||||||
primary_series | string | Names which series drives the headline value and the compact high/low range on iOS. Max 32 chars, and must match one of the value keys to take effect. When omitted (or naming an unknown key), the alphabetically-first series is used. | ||||||||||||||||||||||||||||||||||||||||||||||||||||||||||||||||||||||||||||||||||||||||||||||||
| Llega en la versión 1.14.0 de la app | ||||||||||||||||||||||||||||||||||||||||||||||||||||||||||||||||||||||||||||||||||||||||||||||||||
compact_label | string | Optional, max 4 characters. Replaces the high/low stack in the Dynamic Island compact leading ear. The minimal presentation ignores it. | ||||||||||||||||||||||||||||||||||||||||||||||||||||||||||||||||||||||||||||||||||||||||||||||||
Each push appends a timestamped data point to the server-managed history, which never needs to be sent: a seed on the first update is honored, but once any history exists a client-supplied history is ignored. Up to 300 points per series are stored; APNs payloads are dynamically downsampled via LTTB to fit 4KB while preserving peaks and visual shape.
Renders url_action and secondary_url_action as buttons below the sparkline; tap_action covers taps elsewhere on the card — see Tap actions.
Example: Single Value
{
  "state": "ongoing",
  "content": {
    "template": "timeline",
    "value": {"Temperature": 13.7},
    "unit": "°C",
    "state": "Heating",
    "icon": "thermometer.medium",
    "accent_color": "orange",
    "smoothing": true
  }
}
Example: Multi-Value with Thresholds
{
  "state": "ongoing",
  "content": {
    "template": "timeline",
    "value": {
      "CPU": 72.5,
      "GPU": 45.2,
      "Fan": 60.0,
      "SSD": 38.1
    },
    "unit": "%",
    "units": { "GPU": "°C", "SSD": "°C" },
    "state": "Monitoring",
    "primary_series": "CPU",
    "thresholds": [
      { "value": 80, "color": "red", "label": "Critical" },
      { "value": 60, "color": "orange" }
    ]
  }
}Esta sección describe una función de una actualización de la app que está pendiente de revisión en App Store. Se desbloquea aquí automáticamente en cuanto la actualización esté disponible.
With more than one series, set primary_series: the non-primary series still draw as lines behind the headline.
Value-only updates are delivered at low priority to conserve the iOS push budget. Changing scale, smoothing, decimals, unit, or units triggers high-priority delivery.
Use Cases
- Server monitoring — CPU temperature, memory usage, network throughput over time
- Smart home — room temperature trends, humidity tracking, energy consumption
- 3D printing — hotend/bed temperature curves during a print
- CI/CD — build time trends, test suite duration over consecutive runs