Template Alert
Template berbasis tingkat keparahan untuk peringatan pemantauan. Menampilkan peringatan yang aktif dengan tombol deep link ke dasbor dan aturan peringatan.
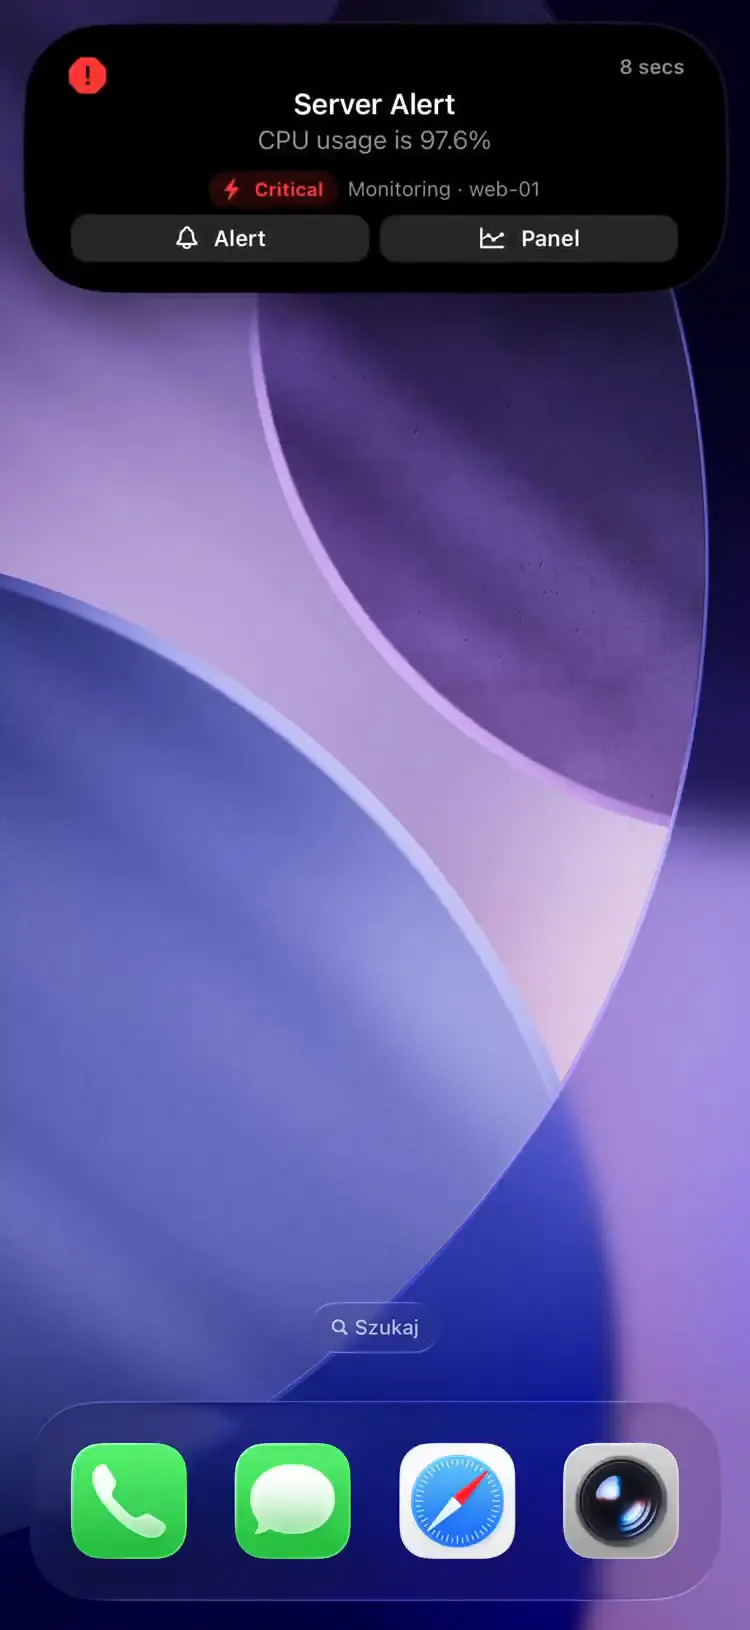
Fields
| Field | Type | Description | ||||||||||||||||||||||||||||||||||||||||||||||||||||||||||||||||||||||||||||||||||||||||||||||||
|---|---|---|---|---|---|---|---|---|---|---|---|---|---|---|---|---|---|---|---|---|---|---|---|---|---|---|---|---|---|---|---|---|---|---|---|---|---|---|---|---|---|---|---|---|---|---|---|---|---|---|---|---|---|---|---|---|---|---|---|---|---|---|---|---|---|---|---|---|---|---|---|---|---|---|---|---|---|---|---|---|---|---|---|---|---|---|---|---|---|---|---|---|---|---|---|---|---|---|
template | string | Required. Must be "alert" | ||||||||||||||||||||||||||||||||||||||||||||||||||||||||||||||||||||||||||||||||||||||||||||||||
progress | float | Required. Usually 0.0 for firing, 1.0 for resolved | ||||||||||||||||||||||||||||||||||||||||||||||||||||||||||||||||||||||||||||||||||||||||||||||||
severity | string | Required. Alert severity: "critical", "warning", or "info" | ||||||||||||||||||||||||||||||||||||||||||||||||||||||||||||||||||||||||||||||||||||||||||||||||
severity_label | string | Optional. Custom text shown in place of the Info/Warning/Critical badge | ||||||||||||||||||||||||||||||||||||||||||||||||||||||||||||||||||||||||||||||||||||||||||||||||
fired_at | integer | Unix timestamp when the alert fired | ||||||||||||||||||||||||||||||||||||||||||||||||||||||||||||||||||||||||||||||||||||||||||||||||
url | string | Primary URL -- tappable button on the Live Activity (e.g. link to alert rule) | ||||||||||||||||||||||||||||||||||||||||||||||||||||||||||||||||||||||||||||||||||||||||||||||||
secondary_url | string | Secondary URL -- second tappable button (e.g. link to dashboard panel) | ||||||||||||||||||||||||||||||||||||||||||||||||||||||||||||||||||||||||||||||||||||||||||||||||
state | string | Alert description (e.g. "CPU usage is 94.2%") | ||||||||||||||||||||||||||||||||||||||||||||||||||||||||||||||||||||||||||||||||||||||||||||||||
icon | string | SF Symbol name (e.g. "exclamationmark.triangle.fill") or MDI icon with mdi: prefix (e.g. "mdi:alert-circle") | ||||||||||||||||||||||||||||||||||||||||||||||||||||||||||||||||||||||||||||||||||||||||||||||||
subtitle | string | Source and target (e.g. "Grafana - nas-01") | ||||||||||||||||||||||||||||||||||||||||||||||||||||||||||||||||||||||||||||||||||||||||||||||||
accent_color | string | Named color or hex (typically "red" for firing, "green" for resolved) | ||||||||||||||||||||||||||||||||||||||||||||||||||||||||||||||||||||||||||||||||||||||||||||||||
background_color | string | Background color override | ||||||||||||||||||||||||||||||||||||||||||||||||||||||||||||||||||||||||||||||||||||||||||||||||
text_color | string | Text color override | ||||||||||||||||||||||||||||||||||||||||||||||||||||||||||||||||||||||||||||||||||||||||||||||||
| Hadir di versi aplikasi 1.14.0 | ||||||||||||||||||||||||||||||||||||||||||||||||||||||||||||||||||||||||||||||||||||||||||||||||||
compact_label | string | Optional, max 4 characters. Replaces the icon in the Dynamic Island compact leading ear. The minimal presentation ignores it. | ||||||||||||||||||||||||||||||||||||||||||||||||||||||||||||||||||||||||||||||||||||||||||||||||
For one-tap acknowledgements, set url_action to a silent webhook, secondary_url_action with foreground: true to open the dashboard in Safari, and tap_action to a custom scheme to deep-link into your alerting tool's iOS app; the legacy url / secondary_url strings render as buttons that open in Safari. See Tap actions.
Example: Firing Alert
Peringatan aktif
{
  "state": "ongoing",
  "content": {
    "template": "alert",
    "progress": 0.0,
    "state": "CPU usage is 94.2%",
    "icon": "exclamationmark.triangle.fill",
    "subtitle": "Grafana · nas-01",
    "severity": "critical",
    "severity_label": "SEV1",
    "fired_at": 1750009000,
    "accent_color": "red",
    "url": "https://grafana.example.com/alerting/1afz29v7z/edit",
    "secondary_url": "https://grafana.example.com/d/abc123?viewPanel=1"
  }
}
Example: Resolved Alert
Peringatan teratasi
{
  "state": "ended",
  "content": {
    "template": "alert",
    "progress": 1.0,
    "state": "Resolved — CPU usage normalized",
    "icon": "checkmark.circle.fill",
    "subtitle": "Grafana · nas-01",
    "severity": "critical",
    "accent_color": "green",
    "url": "https://grafana.example.com/alerting/1afz29v7z/edit"
  }
}
The Relay forwards Grafana, Uptime Kuma and Gatus alerts into this template with deep links.