Mẫu Alert
Một mẫu dựa trên mức độ nghiêm trọng để giám sát cảnh báo. Hiển thị các cảnh báo đang kích hoạt với các nút liên kết sâu đến bảng điều khiển và quy tắc cảnh báo.
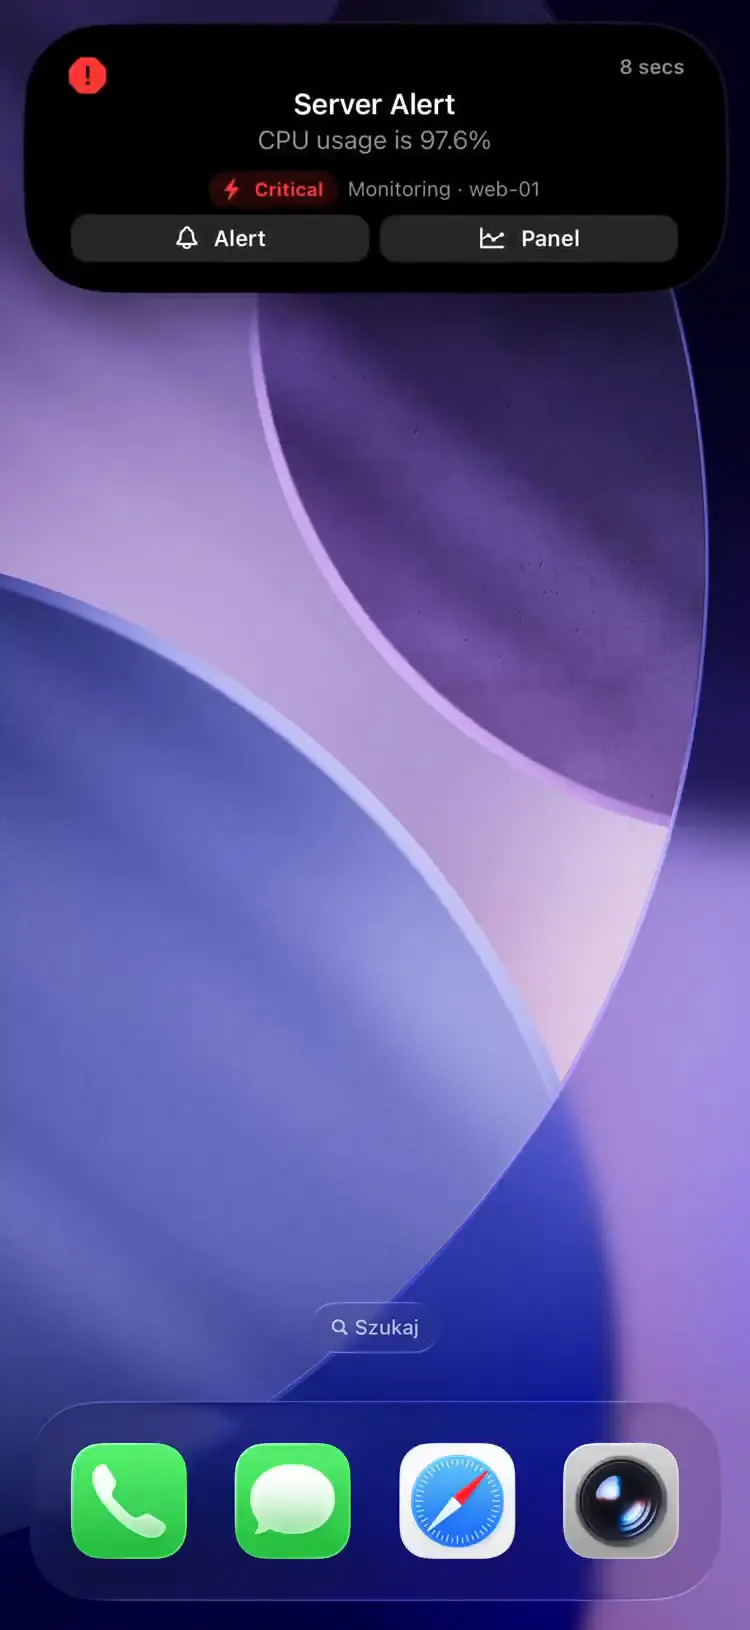
Fields
| Field | Type | Description | ||||||||||||||||||||||||||||||||||||||||||||||||||||||||||||||||||||||||||||||||||||||||||||||||
|---|---|---|---|---|---|---|---|---|---|---|---|---|---|---|---|---|---|---|---|---|---|---|---|---|---|---|---|---|---|---|---|---|---|---|---|---|---|---|---|---|---|---|---|---|---|---|---|---|---|---|---|---|---|---|---|---|---|---|---|---|---|---|---|---|---|---|---|---|---|---|---|---|---|---|---|---|---|---|---|---|---|---|---|---|---|---|---|---|---|---|---|---|---|---|---|---|---|---|
template | string | Required. Must be "alert" | ||||||||||||||||||||||||||||||||||||||||||||||||||||||||||||||||||||||||||||||||||||||||||||||||
progress | float | Required. Usually 0.0 for firing, 1.0 for resolved | ||||||||||||||||||||||||||||||||||||||||||||||||||||||||||||||||||||||||||||||||||||||||||||||||
severity | string | Required. Alert severity: "critical", "warning", or "info" | ||||||||||||||||||||||||||||||||||||||||||||||||||||||||||||||||||||||||||||||||||||||||||||||||
severity_label | string | Optional. Custom text shown in place of the Info/Warning/Critical badge | ||||||||||||||||||||||||||||||||||||||||||||||||||||||||||||||||||||||||||||||||||||||||||||||||
fired_at | integer | Unix timestamp when the alert fired | ||||||||||||||||||||||||||||||||||||||||||||||||||||||||||||||||||||||||||||||||||||||||||||||||
url | string | Primary URL -- tappable button on the Live Activity (e.g. link to alert rule) | ||||||||||||||||||||||||||||||||||||||||||||||||||||||||||||||||||||||||||||||||||||||||||||||||
secondary_url | string | Secondary URL -- second tappable button (e.g. link to dashboard panel) | ||||||||||||||||||||||||||||||||||||||||||||||||||||||||||||||||||||||||||||||||||||||||||||||||
state | string | Alert description (e.g. "CPU usage is 94.2%") | ||||||||||||||||||||||||||||||||||||||||||||||||||||||||||||||||||||||||||||||||||||||||||||||||
icon | string | SF Symbol name (e.g. "exclamationmark.triangle.fill") or MDI icon with mdi: prefix (e.g. "mdi:alert-circle") | ||||||||||||||||||||||||||||||||||||||||||||||||||||||||||||||||||||||||||||||||||||||||||||||||
subtitle | string | Source and target (e.g. "Grafana - nas-01") | ||||||||||||||||||||||||||||||||||||||||||||||||||||||||||||||||||||||||||||||||||||||||||||||||
accent_color | string | Named color or hex (typically "red" for firing, "green" for resolved) | ||||||||||||||||||||||||||||||||||||||||||||||||||||||||||||||||||||||||||||||||||||||||||||||||
background_color | string | Background color override | ||||||||||||||||||||||||||||||||||||||||||||||||||||||||||||||||||||||||||||||||||||||||||||||||
text_color | string | Text color override | ||||||||||||||||||||||||||||||||||||||||||||||||||||||||||||||||||||||||||||||||||||||||||||||||
| Sắp có trong phiên bản ứng dụng 1.14.0 | ||||||||||||||||||||||||||||||||||||||||||||||||||||||||||||||||||||||||||||||||||||||||||||||||||
compact_label | string | Optional, max 4 characters. Replaces the icon in the Dynamic Island compact leading ear. The minimal presentation ignores it. | ||||||||||||||||||||||||||||||||||||||||||||||||||||||||||||||||||||||||||||||||||||||||||||||||
For one-tap acknowledgements, set url_action to a silent webhook, secondary_url_action with foreground: true to open the dashboard in Safari, and tap_action to a custom scheme to deep-link into your alerting tool's iOS app; the legacy url / secondary_url strings render as buttons that open in Safari. See Tap actions.
Example: Firing Alert
Cảnh báo đang kích hoạt
{
  "state": "ongoing",
  "content": {
    "template": "alert",
    "progress": 0.0,
    "state": "CPU usage is 94.2%",
    "icon": "exclamationmark.triangle.fill",
    "subtitle": "Grafana · nas-01",
    "severity": "critical",
    "severity_label": "SEV1",
    "fired_at": 1750009000,
    "accent_color": "red",
    "url": "https://grafana.example.com/alerting/1afz29v7z/edit",
    "secondary_url": "https://grafana.example.com/d/abc123?viewPanel=1"
  }
}
Example: Resolved Alert
Cảnh báo đã được xử lý
{
  "state": "ended",
  "content": {
    "template": "alert",
    "progress": 1.0,
    "state": "Resolved — CPU usage normalized",
    "icon": "checkmark.circle.fill",
    "subtitle": "Grafana · nas-01",
    "severity": "critical",
    "accent_color": "green",
    "url": "https://grafana.example.com/alerting/1afz29v7z/edit"
  }
}
The Relay forwards Grafana, Uptime Kuma and Gatus alerts into this template with deep links.