Board 템플릿
최대 4개의 레이블 타일로 구성된 간결한 대시보드 — 각 타일에 값, 아이콘, 추세 화살표, 자체 탭 대상이 담겨 있어 관련 지표를 한눈에 볼 수 있습니다.
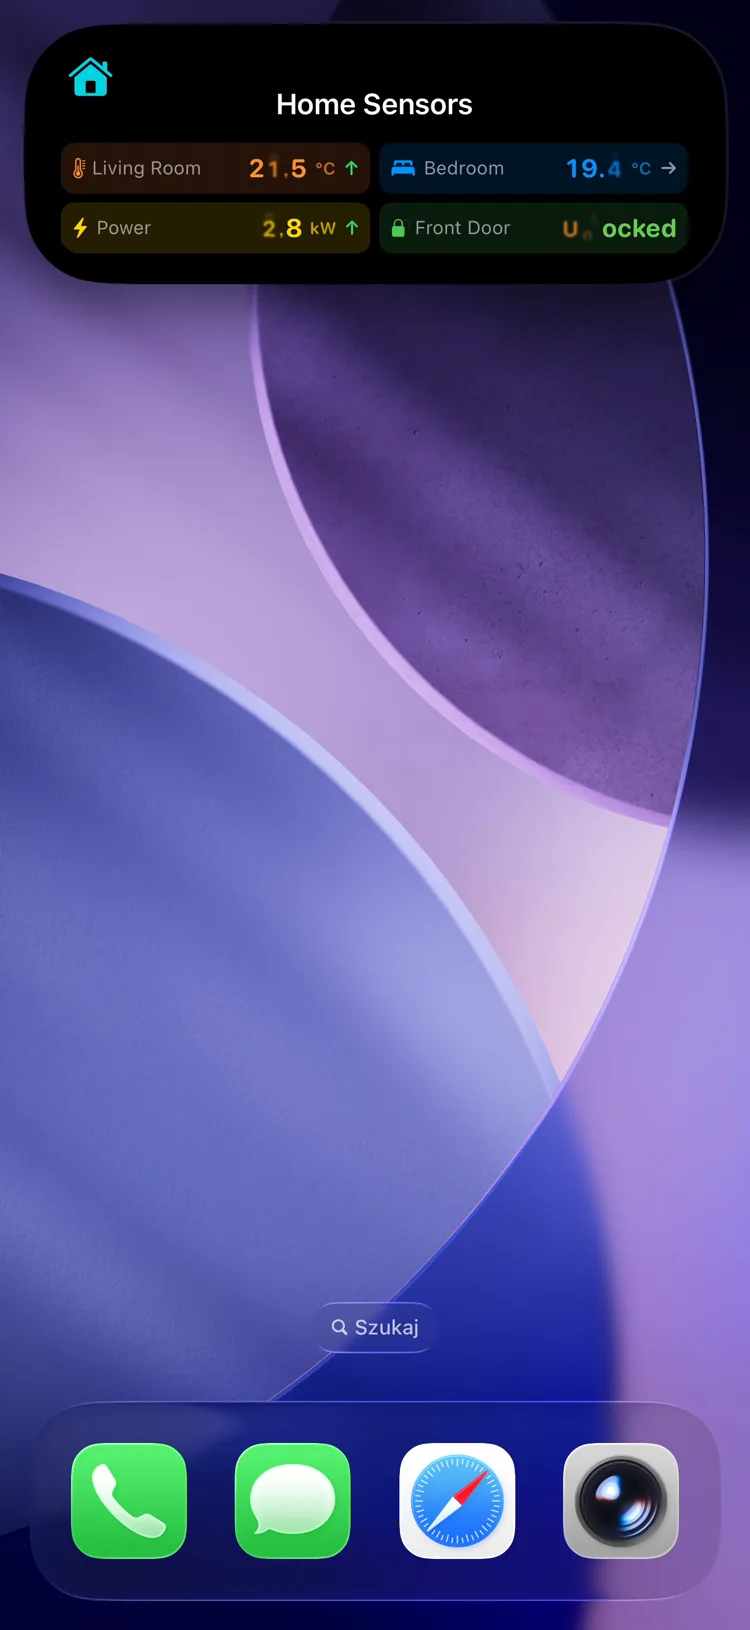
Fields
| Field | Type | Description | ||||||||||||||||||||||||||||||||||||||||||||||||||||||||||||||||||||||||||||||||||||||||||||||||
|---|---|---|---|---|---|---|---|---|---|---|---|---|---|---|---|---|---|---|---|---|---|---|---|---|---|---|---|---|---|---|---|---|---|---|---|---|---|---|---|---|---|---|---|---|---|---|---|---|---|---|---|---|---|---|---|---|---|---|---|---|---|---|---|---|---|---|---|---|---|---|---|---|---|---|---|---|---|---|---|---|---|---|---|---|---|---|---|---|---|---|---|---|---|---|---|---|---|---|
template | string | Required. Must be "board" | ||||||||||||||||||||||||||||||||||||||||||||||||||||||||||||||||||||||||||||||||||||||||||||||||
tiles | array | Required. 1–4 tile objects (see below). Sending more than four is rejected with a validation error. Replaced wholesale on PATCH — re-send the full array and the board redraws in place (why) | ||||||||||||||||||||||||||||||||||||||||||||||||||||||||||||||||||||||||||||||||||||||||||||||||
state | string | Status text shown beside the activity name (e.g. "All systems nominal") | ||||||||||||||||||||||||||||||||||||||||||||||||||||||||||||||||||||||||||||||||||||||||||||||||
icon | string | SF Symbol name (e.g. "server.rack") or MDI icon with mdi: prefix | ||||||||||||||||||||||||||||||||||||||||||||||||||||||||||||||||||||||||||||||||||||||||||||||||
accent_color | string | Named color or hex used for the heading icon and tile values. Default: teal | ||||||||||||||||||||||||||||||||||||||||||||||||||||||||||||||||||||||||||||||||||||||||||||||||
background_color | string | Background color override | ||||||||||||||||||||||||||||||||||||||||||||||||||||||||||||||||||||||||||||||||||||||||||||||||
text_color | string | Text color override | ||||||||||||||||||||||||||||||||||||||||||||||||||||||||||||||||||||||||||||||||||||||||||||||||
| 앱 버전 1.14.0에서 제공 예정 | ||||||||||||||||||||||||||||||||||||||||||||||||||||||||||||||||||||||||||||||||||||||||||||||||||
compact_label | string | Optional, max 4 characters. Replaces the icon in the Dynamic Island compact leading ear. The minimal presentation ignores it. | ||||||||||||||||||||||||||||||||||||||||||||||||||||||||||||||||||||||||||||||||||||||||||||||||
Tile object
Each entry in tiles is an object:
| Field | Type | Description |
|---|---|---|
label | string | Required. Tile caption. Max 32 characters |
value | string | Required. Primary value. Max 16 characters |
unit | string | Unit suffix shown after the value (e.g. "%", "GB"). Max 8 characters |
icon | string | SF Symbol or MDI icon shown beside the label |
color | string | Named color or hex for this tile's value. Falls back to accent_color |
trend | string | One of up, down, flat — renders a trend arrow |
url_action | object | Per-tile tap target. Same shape as tap actions |
Tiles share the ~4 KB APNs payload with the rest of the activity, so keep labels and values short.
Each tile can carry its own url_action, so one board can deep-link to several destinations — see Tap actions.
Example: Service Status Board
서비스 상태 보드
{
  "state": "ongoing",
  "content": {
    "template": "board",
    "state": "All systems nominal",
    "icon": "server.rack",
    "accent_color": "green",
    "tiles": [
      { "label": "Uptime", "value": "99.98", "unit": "%", "icon": "checkmark.circle", "color": "green", "trend": "flat" },
      { "label": "CPU", "value": "47", "unit": "%", "icon": "cpu", "color": "cyan", "trend": "up" },
      { "label": "Memory", "value": "6.2", "unit": "GB", "color": "blue" },
      {
        "label": "Errors",
        "value": "3",
        "unit": "/h",
        "icon": "exclamationmark.triangle",
        "color": "orange",
        "trend": "down",
        "url_action": { "url": "https://grafana.example.com/errors", "foreground": true }
      }
    ]
  }
}
Use Cases
- Infrastructure — uptime, CPU, memory, and error-rate at a glance
- Smart home — room temperatures, energy use, device states
- Media servers — active streams, queue depth, transcodes, library size
- Sports & finance — scoreboards, portfolio tickers, KPI dashboards